Highlights of Financial Results
Business Report FY06/25(July 1, 2024 to June 30, 2025)
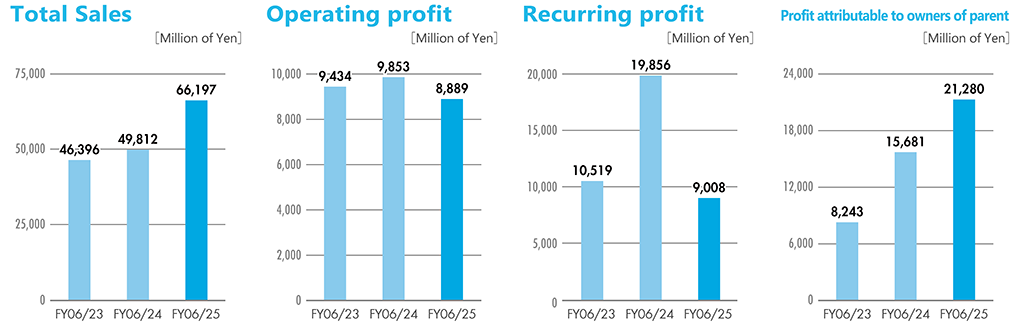
In FY06/25, consolidated sales were JPY66,197mn (+32.9% YoY), operating profit was JPY8,889mn (-9.8% YoY), recurring profit was JPY9,008mn (-54.6% YoY), and net income attributable to owners of the parent was JPY21,280mn (+35.7% YoY). In the Security Equipment segment and Card Equipment and Other Office Equipment segment, sales increased YoY. In the Peripheral Computer Equipment segment, sales and profit decreased YoY, driven by the economic slowdown in Western countries, the main markets for small cutting machines. Net income attributable to owners of the parent increased YoY, driven by the recognition of an extraordinary gain on negative goodwill associated with the transition of IWATSU ELECTRIC CO., LTD. and NAKAYO, INC. to a wholly owned subsidiary.
Performance by Segment
[Sales composition ratio]
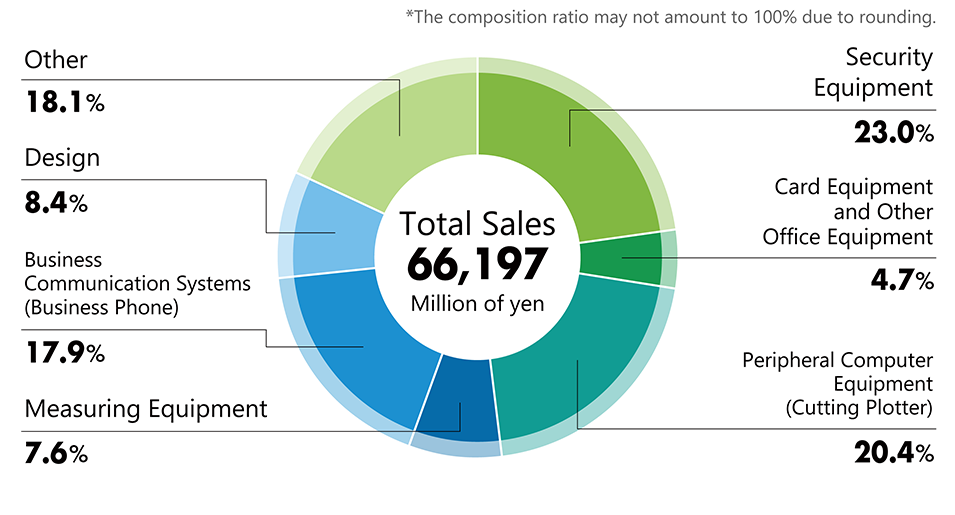
●Security Equipment segment
Sales: JPY15,201mn (+6.9% YoY)
Segment profit: JPY6,150mn (+4.3% YoY)
●Card Equipment and Other Office Equipment segment
Sales: JPY3,105mn (+2.6% YoY)
Segment profit: JPY831mn (+2.8% YoY)
●Peripheral Computer Equipment segment
Sales: JPY13,492mn (-16.9% YoY)
Segment profit: JPY462mn (-67.6% YoY)
●Measuring Equipment segment
Sales: JPY5,004mn (+151.1% YoY)
Segment profit: JPY826mn (+22.7% YoY)
●Business Communication Systems segment
Sales: JPY11,825mn
Segment profit: JPY678mn
●Design
Sales: JPY5,566mn (-0.2% YoY)
Segment profit: JPY472mn (-17.9% YoY)
●Other
Sales: JPY12,000mn (+37.0% YoY)
Segment profit: JPY163mn (-66.1% YoY)
Consolidated Balance Sheet
[millions of yen]
| FY06/24 | FY06/25 | |
| ASSETS | ||
| Current assets | 56,194 | 83,265 |
| Cash and deposits | 36,084 | 45,055 |
| Accounts receivable | 7,963 | 17,822 |
| Investments in leases | 665 | 441 |
| Merchandise and finished goods | 8,181 | 9,729 |
| Work in Process | 123 | 1,695 |
| Raw materials and supplies | 1,050 | 5,786 |
| Other | 2,124 | 2,735 |
| Fixed assets | 37,707 | 57,640 |
| Tangible fixed assets | 10,844 | 33,252 |
| Intangible fixed assets | 2,270 | 3,344 |
| Investments and other assets | 24,591 | 21,043 |
| Total assets | 93,901 | 140,906 |
| LIABILITIES | ||
| Current liabilities | 9,973 | 16,565 |
| Accounts Payable | 3,960 | 6,851 |
| Lease liabilities | 418 | 359 |
| Income taxes payable | 1,011 | 1,574 |
| Other | 4,582 | 7,780 |
| Fixed liabilities | 3,413 | 12,274 |
| Total liabilities | 13,387 | 28,840 |
| NET ASSETS | ||
| Shareholders’ Equity | 75,305 | 105,778 |
| Capital stock | 5,000 | 5,000 |
| Capital surplus | 8,958 | 19,648 |
| Retained earnings | 66,054 | 82,806 |
| Treasury share | -4,707 | -1,676 |
| Accumulated other comprehensive income | 4,726 | 3,765 |
| Non-controlling interests | 482 | 2,522 |
| Total net assets | 80,514 | 112,065 |
| Total liabilities and net assets | 93,901 | 140,906 |
Consolidated Statements of Income
[millions of yen]
| FY06/24 | FY06/25 | |
| Total sales | 49,812 | 66,197 |
| Cost of sales | 25,033 | 35,853 |
| Gross profit | 24,779 | 30,343 |
| SG&A expenses | 14,925 | 21,454 |
| Operating profit | 9,853 | 8,889 |
| Non-operating income | 10,192 | 731 |
| Non-operating expenses | 190 | 613 |
| Recurring profit | 19,856 | 9,008 |
| Extraordinary gains | 1 | 19,290 |
| Extraordinary losses | 1,292 | 7,081 |
| Profit before income taxes | 18,564 | 21,217 |
| Income taxes | 2,764 | -66 |
| Net Profit | 15, 799 | 21,284 |
| Profit attributable to non-controlling interests | 118 | 3 |
| Profit attributable to owners of parent | 15,681 | 21,280 |
Consolidated Statements of Cash Flows
[millions of yen]
| FY06/24 | FY06/25 | |
| Cash flows from operating activities | 8,432 | 7,647 |
| Cash flows from investing activities | -6,428 | 7,084 |
| Cash flows from financing activities | -4,675 | -5,384 |
| Effect of exchange rate change on cash and cash equivalents | 1,050 | -577 |
| Net increase (decrease) in cash and cash equivalents | -1,621 | 8,769 |
| Cash and cash equivalents at beginning of period | 37,566 | 36,021 |
| Increase in cash and cash equivalents
resulting from inclusion of subsidiaries in consolidation |
76 | - |
| Cash and cash equivalents at end of period | 36,021 | 44,790 |
Changes in Key Financial Indicators